How to Read Your Meta Ad Account Like a Growth Engineer
Most marketers open Ads Manager, look at ROAS, and either feel good or feel bad. That is not reading your ad account. That is checking your emotional state.
Reading an ad account means looking at the right numbers in the right order to understand what is actually happening, why it is happening, and what to do next. It means knowing which metric to trust when two metrics contradict each other. It means catching a problem on Tuesday instead of discovering it on Friday when the weekly report comes in.
This is the operating system we use at Gemoniq to read every ad account we manage. It is not complicated, but it is specific. Most teams have never been shown how to do this properly.
In this article:
- The default Ads Manager view is designed to mislead you
- The custom column setup that actually tells you something
- How to read an ad account in layers (not in rows)
- The five numbers that matter and the ten that do not
- Weekly, daily, and monthly reading rhythms
- How to build the diagnostic dashboard that catches problems early
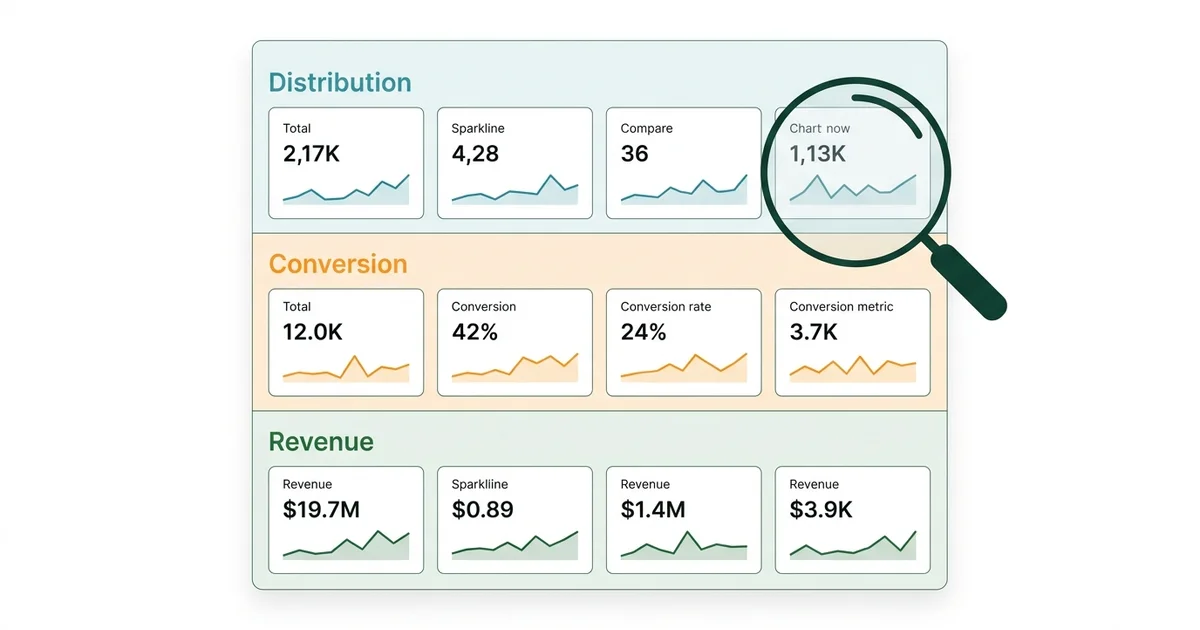
The default view is designed to mislead you
When you open Meta Ads Manager for the first time, the default columns show you: delivery status, bid strategy, budget, amount spent, results, cost per result, reach, impressions, and frequency.
This looks useful. It is not. Here is why.
“Results” and “cost per result” depend entirely on what you optimized for. If you optimized for link clicks, “results” shows link clicks and “cost per result” shows CPC. If you optimized for purchases, it shows purchases and CPA. The same column label means completely different things depending on your campaign setup.
This means two campaigns sitting next to each other in the same view might be measuring fundamentally different things under the same header. One shows cost per click at $0.80 and looks great. The other shows cost per purchase at $45 and looks terrible. Both say “cost per result.” Neither number means anything without context.
The default view also hides the metrics that actually matter for diagnosis: landing page view rate, ThruPlay rate, add-to-cart rate, and the ratio between clicks and conversions. These are the signals that tell you where the funnel is breaking. Meta does not show them by default because they require you to think about your funnel in layers, and most advertisers do not.
The attribution trap
Meta’s default attribution window is 7-day click, 1-day view. This means someone who saw your ad, did not click, but bought within 24 hours gets counted as a conversion. This inflates your numbers. For honest reporting, compare 7-day click only against your actual revenue. The gap between those two numbers is your attribution inflation.
The custom column setup that actually tells you something
Here is the exact column setup we use across every account at Gemoniq. Set this up once, save it as a preset, and use it as your default view.
Layer 1 columns (Distribution health)
| Column | Why it matters |
|---|---|
| Reach | How many unique people saw your ad |
| Impressions | Total times your ad was shown (includes repeats) |
| Frequency | Impressions divided by reach. Above 3.0 on cold audiences means saturation |
| CPM | Cost per 1,000 impressions. Your “cost of attention” |
| ThruPlay rate | Percentage who watched 15+ seconds (video only). Below 20% means the hook failed |
| 3-second video plays / impressions | Your real hook rate. The percentage of people who stopped scrolling |
Layer 2 columns (Conversion intent)
| Column | Why it matters |
|---|---|
| Link clicks | People who clicked to your site |
| CTR (link click-through rate) | Link clicks divided by impressions. Below 1% on cold traffic is weak |
| CPC (cost per link click) | What you pay per click. Context-dependent, not inherently good or bad |
| Landing page views | People who actually loaded your page (always lower than link clicks) |
| LP view rate | Landing page views divided by link clicks. Below 70% means your page is too slow |
Layer 3 columns (Revenue realization)
| Column | Why it matters |
|---|---|
| Add to cart | First commercial intent signal |
| Initiate checkout | Stronger intent signal |
| Purchases | Actual revenue events |
| Purchase conversion value | Total revenue attributed |
| ROAS | Return on ad spend. Revenue divided by spend |
| CPA | Cost per acquisition. Spend divided by purchases |
| ATC-to-purchase rate | Add to cart divided by purchases. Shows checkout friction |
How to save this
In Ads Manager, click “Columns: Performance” dropdown, then “Customize Columns.” Add the columns above in this order. Click “Save as Preset” and name it “Growth Diagnostic.” Use this as your default view going forward.
This single change will make you a better media buyer overnight. You will start seeing patterns that were invisible in the default view.
How to read an ad account in layers, not rows
Most people read Ads Manager left to right, row by row. They look at Campaign A, check its numbers, then look at Campaign B. This tells you which campaign is “better” but not why.
The layer-reading method is different. Instead of comparing campaigns against each other, you read each campaign through the three diagnostic layers. (This is the same 3-Layer Diagnosis framework we use for troubleshooting, but here we are using it as a reading pattern, not just a diagnostic tool.)
Step 1: Read Layer 1 first (distribution)
Before you look at any conversion number, check:
- Is reach growing, flat, or declining week over week?
- Is frequency below 3.0 on cold audiences?
- Is CPM stable or climbing?
- For video: is ThruPlay rate above 20%?
If Layer 1 is unhealthy, stop reading. Nothing downstream matters yet. Fix distribution first.
Step 2: Read Layer 2 only if Layer 1 is healthy
If reach is growing and frequency is controlled:
- Is CTR above 1% on cold traffic?
- Is landing page view rate above 70% of link clicks?
- If both are weak, the ad is getting seen but not driving action. The problem is your CTA, your promise, or your offer framing.
Step 3: Read Layer 3 only if Layer 2 is healthy
If people are clicking and landing on your page:
- What is the add-to-cart rate? (Below 3% on a product page is weak)
- What is the ATC-to-purchase ratio? (Below 50% means checkout friction)
- Is CPA trending up, down, or stable over 7 days?
This layered reading prevents the most common mistake in media buying: blaming the ad when the problem is the landing page, or blaming the landing page when the problem is the hook.
“Read your ad account in layers, not rows. The order you look at the numbers matters more than the numbers themselves.
”
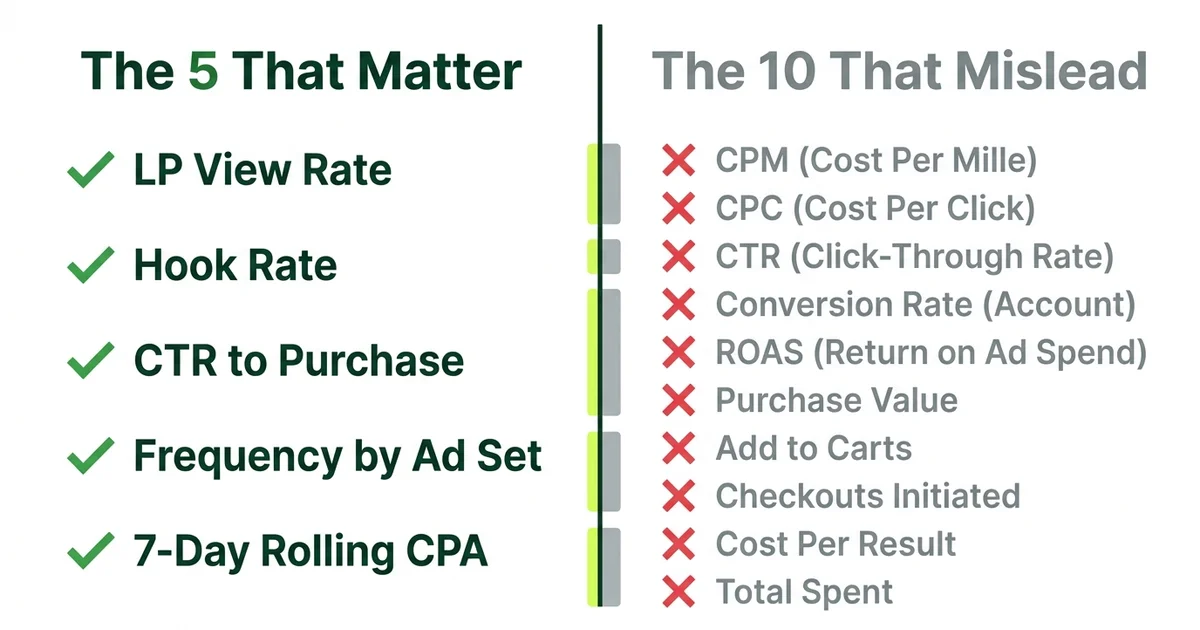
The five numbers that matter and the ten that do not
The five that matter
1. Landing page view rate (LP views / link clicks)
This is the most underrated metric in Meta advertising. It tells you how many people who clicked actually saw your page. If this number is below 70%, you are paying for clicks that never arrive. The usual cause is page load speed, but it can also be accidental clicks (especially on mobile placements) or redirect chains.
2. Hook rate (3-second video plays / impressions)
For video ads, this is your real scroll-stopping metric. It tells you what percentage of people who were shown your ad actually paused to watch. A hook rate below 25% means your opening frame is not interrupting the scroll. This is a Layer 1 problem and no amount of CTA optimization will fix it. (For how to build better hooks, read The Human Ads Playbook.)
3. CTR to purchase ratio
Take your purchase count and divide by your link clicks. This gives you your end-to-end conversion rate from click to sale. If this number is below 1%, your post-click experience is leaking. If it is above 3%, you have something working well and should scale it.
4. Frequency by ad set (not campaign level)
Campaign-level frequency averages across all ad sets and hides saturation in individual audiences. Check frequency at the ad set level. If any ad set is above 3.0 on a cold audience, that audience is exhausted. Pause or refresh the creative for that specific ad set.
5. 7-day rolling CPA
Daily CPA is noise. Weekly CPA is signal. Plot your CPA on a 7-day rolling average. If the trend line is flat, your system is stable. If it is climbing, diagnose by layer. If it is declining, you are improving and should consider scaling spend.
The ten that do not matter (or actively mislead)
- Relevance score / quality ranking: Directionally interesting but not actionable. A high relevance score with a high CPA means nothing.
- Post engagement: Likes and comments feel good but do not predict purchases.
- Video average watch time: Misleading because it is skewed by short views. Use ThruPlay rate instead.
- Impressions (in isolation): Without reach context, impressions tell you nothing.
- CPM (in isolation): CPM varies by audience, placement, and time of year. A high CPM with a low CPA is fine.
- Cost per ThruPlay: Interesting for brand campaigns, irrelevant for performance campaigns.
- Daily ROAS: Too noisy to act on. Use 3 to 5 day rolling average.
- Link clicks (without LP view rate): Clicks that do not arrive are not clicks.
- Results (default column): Means different things per campaign. Replace with the specific metric.
- Amount spent: Spending more is not bad. Spending more with rising CPA is bad.
Want Us to Set This Up for You?
We'll configure your custom diagnostic view, build the reporting dashboard, and show you exactly how to read your specific account in 30 minutes.
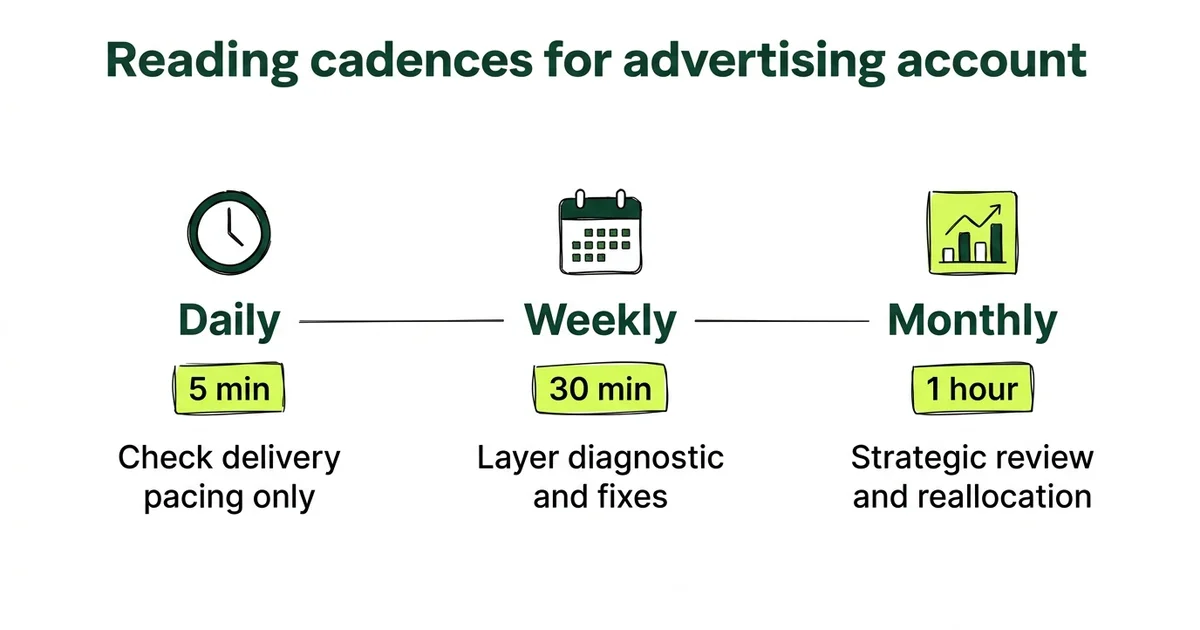
The reading rhythms: daily, weekly, monthly
Checking your ad account every hour is a waste of time. Checking it once a month is negligent. Here is the cadence that balances signal quality with reaction time.
Daily check (5 minutes)
Look at one thing only: is delivery pacing on track? Are your campaigns spending their daily budgets? If spend is significantly below target, something is wrong with delivery (audience too narrow, bid too low, ad rejected). If spend is on track, close the tab. Come back tomorrow.
Do not look at ROAS daily. Do not look at CPA daily. The sample size is too small for those numbers to mean anything on a single day.
Weekly diagnostic (30 minutes, Monday or Tuesday)
This is where the real reading happens. Pull up your Growth Diagnostic view and:
- Compare this week’s Layer 1 metrics to last week. Flag anything that moved more than 20%.
- Check Layer 2 for any campaign where CTR dropped or LP view rate dropped.
- Check Layer 3 for CPA trends on 7-day rolling average.
- For each flagged metric, tag the diagnosis: Layer 1, 2, or 3 problem.
- Write down the one to two changes you will make this week based on the diagnosis.
This 30-minute weekly review replaces hours of reactive daily checking and produces better decisions.
Monthly review (1 hour, first Monday of the month)
Zoom out. Look at month-over-month trends:
- Is overall CPA trending up or down across 30 days?
- Which creative themes produced the best results this month?
- Which audiences are showing saturation (rising frequency, declining CTR)?
- How does this month’s spend-to-revenue ratio compare to last month?
The monthly review is where you make strategic decisions: kill underperforming audience segments, double down on winning creative themes, adjust budget allocation between campaigns.
Building the diagnostic dashboard
The column setup gives you the raw numbers. The dashboard gives you the trends and the automatic flags that catch problems before they compound.
What to build
You do not need expensive tools for this. A spreadsheet works. Here is the structure:
Weekly tracker (one row per week, per campaign):
- Campaign name
- Spend
- Reach
- Frequency
- CPM
- CTR
- LP view rate
- Add to cart rate
- CPA
- ROAS
- Diagnosis tag (Layer 1/2/3 or “healthy”)
- Action taken
The diagnosis tag column is the most important one. It forces you to name the problem before you try to fix it. Most teams skip this step and jump straight to “let’s try new creative,” which is only the right answer about one-third of the time.
Automated flags
Set conditional formatting (or simple IF formulas) to highlight:
- Frequency above 3.0 (red)
- LP view rate below 70% (red)
- CTR below 1% (yellow)
- CPA more than 20% above target (red)
- Week-over-week CPA increase above 15% (orange)
These flags turn your spreadsheet into an early warning system. When a number turns red, you know where to look and what layer to diagnose.
The compound effect of weekly diagnosis
After 4 weeks of this routine, you will have a dataset of what you tried, what worked, and which layer each problem lived in. After 8 weeks, you will start seeing patterns specific to your brand and audience. After 12 weeks, you will be making decisions most media buyers never get to because they are still guessing week to week.
The gap between reading and operating
Knowing how to read your ad account is necessary but not sufficient. The reading tells you what is happening. The operating system tells you what to do about it and ensures the fix actually gets implemented, tested, and measured.
That is the difference between checking your ads and running a growth loop. For the full operating system that wraps this diagnostic reading into a weekly execution cadence, read The AI Growth Loop.
How Gemoniq reads ad accounts for D2C brands
This reading system is not something we teach and walk away. It is built into how we operate Meta Ads end to end for D2C brands.
Every account we manage gets:
- Custom diagnostic view configured on day one with the exact column setup described above.
- Weekly layer-by-layer reading with diagnosis tags and prescribed fixes, not just reports.
- Automated flags that catch distribution decay, conversion drops, and revenue leaks before they become expensive.
- Monthly strategic reviews that connect ad performance to business outcomes and inform the next month’s creative and audience strategy.
The result: you get a team that reads your ad account the way a growth engineer reads a system, not the way a media buyer checks a dashboard.
See How We'd Read Your Ad Account
We'll pull up your Meta ad account, walk through the diagnostic view, and show you exactly which layers are healthy and which are leaking. Free, 30 minutes, no pitch.
Architectural Intelligence
Get the weekly newsletter on design-led performance marketing, directly to your inbox.
No spam. Just intelligence. Unsubscribe anytime.