Facebook Ads Not Working? The 3-Layer Diagnosis
Your CPC is down. Your CTR looks healthy. Quality scores are solid. And yet: conversions are flat. Revenue isn’t moving. Your CMO wants answers and you don’t have them.
This is the most common and most misdiagnosed problem in Meta advertising. Teams stare at ad metrics, see green numbers, and assume the ads are working. Then they stare at revenue, see nothing, and assume the ads need to change.
That assumption is wrong about two-thirds of the time.
The real issue is almost never “the ads aren’t working.” It’s that the ads are working on one layer and failing on a different one, and most teams don’t have a system for telling the difference.
This article gives you that system.
In this article:
- Why good ad metrics don’t guarantee results
- The 3-Layer Diagnosis: distribution, conversion, and revenue
- How to read each layer in Meta Ads Manager
- The five most common failure patterns (and what to do about each one)
- The weekly diagnostic routine that catches problems before they compound
- When to stop fixing ads and start fixing what happens after the click
Why good metrics and bad results happen at the same time
Here’s a scenario we see constantly across accounts we manage at Gemoniq:
A D2C brand runs Meta ads for 8 weeks. The first 3 weeks are strong. ROAS is 6x or higher. Then performance starts drifting. By week 6, the same campaigns that were printing money are barely breaking even. By week 8, the team is panicking.
The instinct is always the same: “Let’s make new creative.” So they produce 10 new ad variants, launch them, and wait. Sometimes it works temporarily. Usually it doesn’t.
The reason it doesn’t work is that creative was never the problem. The ads were still getting attention. People were still clicking. The breakdown was happening somewhere else entirely, either in the handoff between ad and landing page, or in the onboarding flow after the landing page.
Changing the creative in that situation is like replacing the engine on a car with a flat tire. Expensive. Time-consuming. And it doesn’t fix anything.
The core principle
Before you change anything, diagnose which layer is actually broken. The fix for a distribution problem is completely different from the fix for a conversion problem, which is completely different from the fix for a revenue problem.
The 3-Layer Diagnosis Framework
This is the framework we use at Gemoniq across every account we manage. It separates ad performance into three distinct layers, each with its own signals and its own fixes. (We introduced this framework in The AI Growth Loop. Here we go deeper into how to actually run the diagnosis inside Meta Ads Manager.)
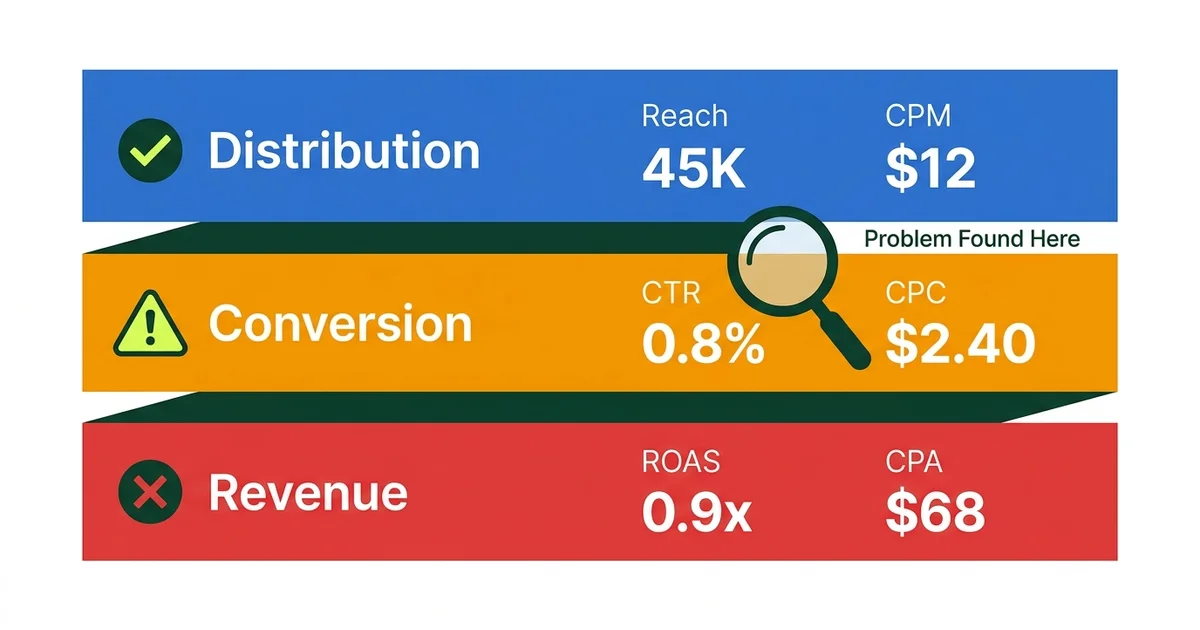
Layer 1: Distribution (Are people seeing your ad?)
What you’re measuring: reach, impressions, CPM, frequency, video hold rate (for video ads), ThruPlay rate
What “broken” looks like:
- Reach is declining week over week with no budget change
- CPM is climbing while volume stays flat
- Frequency is above 3.0 on a cold audience
- Video hold rate below 15% at the 3-second mark
What’s actually going wrong:
If this layer is weak, the problem lives in the first 1 to 3 seconds of your ad. The algorithm is trying to show your ad to people, but those people are scrolling past it. Meta’s delivery system learns fast: if early viewers don’t engage, it stops finding new ones.
The most common causes:
- Hook failure. The opening frame or line doesn’t interrupt the scroll. It looks like an ad, so it gets filtered out unconsciously. (For the full breakdown on why this happens and how to fix it, read The Human Ads Playbook.)
- Format mismatch. You’re running a polished 16:9 video in a feed that rewards vertical, native-feeling content. The container is wrong even if the message is right.
- Audience exhaustion. Your frequency is too high because the audience is too small. Meta has shown your ad to everyone in the pool and is now re-showing it to people who already decided to ignore it.
- Creative fatigue. The same hook structure has been running for more than 5 to 7 days. Even a good hook decays as the responsive audience gets saturated.
How to fix it:
Don’t rewrite the entire ad. Isolate the variable:
- Test a new hook (first 3 seconds) on the same ad body and CTA
- Test a new format (static to carousel, video to slideshow) with the same message
- Expand the audience if frequency is the issue
- Rotate hook families using the 50/30/20 portfolio method
If you change the hook and distribution improves, you’ve confirmed it was a Layer 1 problem. Move on.
Layer 2: Conversion Intent (Are they taking the next step?)
What you’re measuring: CTR (link click-through rate), CPC (cost per link click), landing page view rate, add-to-cart rate, initiate checkout rate
What “broken” looks like:
- Strong reach and impressions but CTR below 1%
- Healthy CTR but landing page view rate below 50% of clicks
- Landing page views are strong but add-to-cart is below 3%
- CPC is low but nothing happens after the click
What’s actually going wrong:
Layer 2 problems are handoff problems. The ad earned attention, but the transition from ad to action is breaking. This is the most frequently misdiagnosed layer because the ad metrics look fine.
The most common causes:
- Vague CTA. “Learn more” tells people nothing. “See the starter kit for $29” tells them exactly what happens next and what it costs. We’ve seen this single change shift CTR by 30 to 50% with zero change to the creative itself.
- Promise mismatch. The ad makes a specific claim (“14 formulations, 8 months of testing”) but the click leads to a generic product page that says “Premium skincare for modern women.” The specificity that earned attention disappears at the moment of decision.
- Page load speed. If your landing page takes more than 3 seconds to load on mobile, you’re losing 30 to 50% of your clicks before they even see the page. Check landing page view rate vs. link clicks. If there’s a big gap, speed is likely the issue.
- Too many steps. Every additional click between ad and purchase is a leak. If someone clicks your ad and lands on a homepage instead of a product page, you’ve added friction that kills conversion.
How to fix it:
- Rewrite the CTA to be specific: include the product, the price, or the action
- Ensure the first fold of the landing page mirrors the ad’s core promise
- Check page speed with Google PageSpeed Insights (aim for under 2.5 seconds on mobile)
- Send traffic to a dedicated landing page, not your homepage
“High views with low click-through is one of the most common and most misdiagnosed patterns in Meta advertising. Teams rewrite the entire ad when the only problem is the CTA.
”
Layer 3: Revenue Realization (Are they paying and staying?)
What you’re measuring: purchase conversion rate, cost per acquisition (CPA), return on ad spend (ROAS), onboarding completion rate, Day 7 retention
What “broken” looks like:
- Clicks and landing page views are strong but purchases are near zero
- CPA is climbing while CTR stays healthy
- First-time purchase rate is fine but repeat purchase rate is declining
- ROAS was strong for weeks then collapsed without any ad changes
What’s actually going wrong:
If users are arriving at your site but not converting, stop rewriting your ads. The ads are doing their job. The leak has moved downstream.
The most common causes:
- Onboarding friction. The landing page doesn’t deliver on the ad’s promise fast enough. If your ad promised simplicity but your checkout has 6 steps and a mandatory account creation, you’re breaking the contract.
- Price or offer mismatch. The ad attracted bargain-hunting traffic but the landing page shows full-price products. Or the ad promised a free trial but the page leads with annual pricing.
- Trust gap. No reviews, no social proof, no trust badges near the purchase button. The ad built interest but the page doesn’t close the sale.
- Wrong traffic, right ad. Sometimes the ad is genuinely reaching people who will never buy. But this is rarer than most teams think. Check your audience overlap and exclusions before assuming the targeting is wrong.
How to fix it:
- Map the exact journey from ad click to purchase. Count every step. Remove every unnecessary one.
- Place proof elements (reviews, testimonials, trust badges) near decision points, not at the bottom of the page
- Match the offer structure to the ad’s promise. If the ad says “starter kit for $29,” the landing page should show that kit at that price above the fold.
- Check your checkout flow on mobile. Most Meta traffic is mobile. If checkout is painful on a phone, that’s your problem.
Not Sure Which Layer Is Broken?
We'll run a free diagnostic across your Meta ad account, landing pages, and post-click flow. In 30 minutes, you'll know exactly where the leak is.
The five most common failure patterns
After managing dozens of Meta ad accounts, these are the patterns we see most often. Each one has a specific signature in the data and a specific fix.
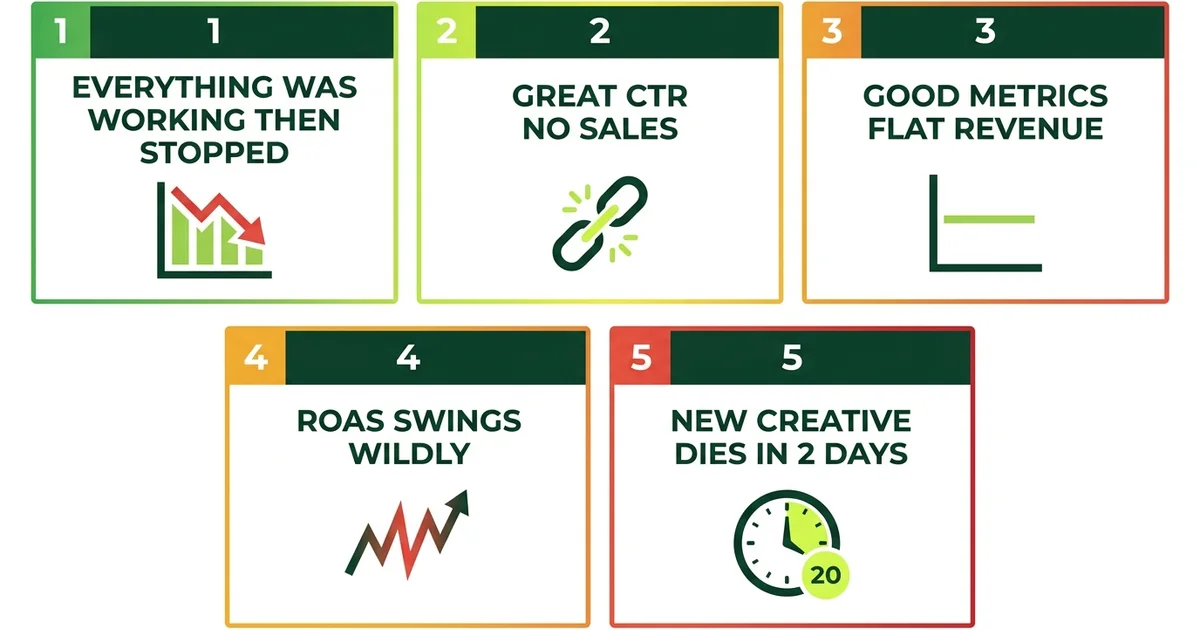
Pattern 1: “Everything was working, then it just stopped”
Signature: Strong performance for 2 to 4 weeks, then gradual decline across all metrics.
Diagnosis: Almost always creative fatigue combined with audience saturation. The algorithm found your best audience, showed them your best ad, and now both are exhausted.
Fix: This is a portfolio rotation problem. You needed bridge variants and explore variants ready before the winners decayed. Implement the 50/30/20 hook portfolio method and never run a single winning creative until it dies again. Full breakdown here.
Pattern 2: “Great CTR, no sales”
Signature: CTR above 2%, CPC is low, but conversion rate on the landing page is below 1%.
Diagnosis: Layer 2 or Layer 3 problem. The ad is earning clicks but the post-click experience is breaking the promise.
Fix: Open the landing page. Read the first thing a visitor sees. Now read your ad. Do they say the same thing? If not, that’s your problem. Align the landing page headline and first fold to the specific promise in the ad.
Pattern 3: “Metrics look great on paper, revenue is flat”
Signature: All ad-level metrics (CPM, CTR, CPC) are improving quarter over quarter. Revenue is flat or declining.
Diagnosis: You’re optimizing the wrong metric. Ad-level efficiency can improve while business results stagnate if the funnel downstream is leaking. This is the pattern from the Reddit post where a marketer had CPC down 22% and CTR at 5.8% but conversions flat, because 8 different campaigns all landed on the same 3 generic pages.
Fix: Stop looking at ad metrics in isolation. Build a dashboard that connects ad spend to revenue, not just to clicks. Then diagnose by layer: are people seeing the ad (Layer 1), clicking (Layer 2), or buying (Layer 3)?
Pattern 4: “ROAS swings wildly day to day”
Signature: 8x ROAS on Monday, 0.5x on Tuesday, 6x on Wednesday. No changes to campaigns.
Diagnosis: This is normal Meta behavior at low spend levels. The algorithm is exploring and the sample size is too small for stable results. If you’re spending less than $200/day per ad set, daily ROAS will be noisy.
Fix: Stop looking at daily ROAS. Evaluate on 3 to 5 day rolling averages instead. If the rolling average is trending down, then diagnose by layer. If it’s just noisy but stable on average, the system is working and you need patience (or more budget for faster signal).
Pattern 5: “New creative works for 2 days then dies”
Signature: Every new ad gets a burst of performance in the first 48 hours, then drops to baseline.
Diagnosis: You’re likely hitting the same small audience repeatedly. Meta gives new creative a brief distribution boost (the “learning phase honeymoon”), but if the audience pool is limited, it exhausts quickly.
Fix: Test broader audiences before assuming it’s a creative problem. Expand your targeting or use Advantage+ audience settings to let Meta find buyers outside your defined audience. If the audience is already broad, then the hook is only resonating with a thin slice. Test fundamentally different hook angles, not just variants of the same one.
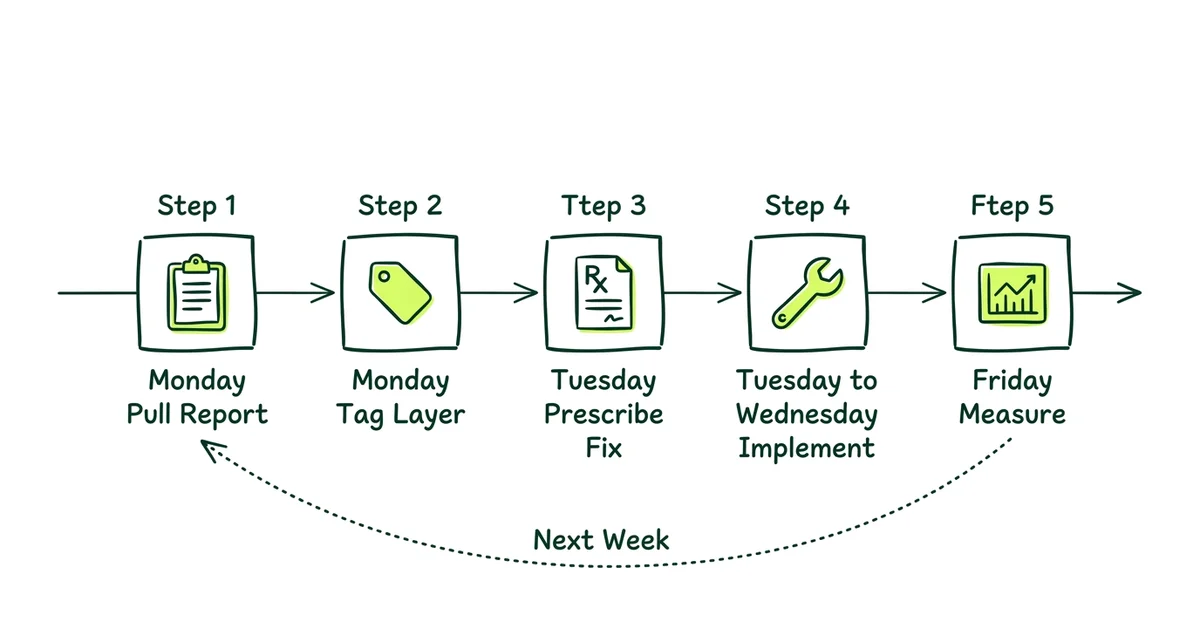
The weekly diagnostic routine
Don’t wait for performance to collapse before diagnosing. Build this into your weekly cadence:
Pull the 3-layer report (Monday)
For each active campaign, record: reach trend (Layer 1), CTR and landing page view rate (Layer 2), conversion rate and CPA (Layer 3). Flag any metric that moved more than 20% from the previous week.
Tag the failure layer (Monday)
For each flagged campaign, determine which layer is declining. Don’t guess. Use the signals above. Write it down: “Campaign X has a Layer 2 problem: CTR dropped 30% while reach held steady.”
Prescribe the fix (Tuesday)
For each tagged problem, choose the specific fix from the framework above. Layer 1 problems get hook or format changes. Layer 2 problems get CTA or landing page changes. Layer 3 problems get post-click flow changes.
Implement one variable at a time (Tuesday to Wednesday)
Don’t change hooks, CTAs, and landing pages simultaneously. You won’t know what worked. Change one variable per campaign, per cycle. This is what separates diagnosis from guessing.
Measure and compare (Friday)
After 3 to 4 days, check if the flagged metric improved. If yes, the diagnosis was correct. Scale the fix. If no, re-diagnose. Maybe the problem is one layer deeper than you thought.
This five-step routine takes about 2 hours per week. It replaces the “let’s just make new creative and hope” approach that most teams default to, and it compounds. Every week, your understanding of what works for your specific audience gets sharper.
For the full 7-day operating cadence that wraps this diagnostic into a complete content and ads workflow, see The AI Growth Loop: the 7-day operator sprint.
The most expensive mistake in Meta advertising
Solving the wrong layer. If your ads are getting views but not clicks, the problem is your CTA, not your hook. If people are clicking but not buying, the problem is your landing page, not your ad. Diagnosing the right layer before changing anything saves weeks of wasted budget.
When to stop fixing ads entirely
Sometimes the ads are fine. The landing page is fine. The checkout is fine. And results are still declining.
When you’ve diagnosed all three layers and can’t find the problem in your ad account, look outside it:
- Market saturation. You’ve reached everyone in your addressable audience on Meta. Growth requires a new channel, not better ads.
- Product-market fit drift. The product that resonated 6 months ago doesn’t resonate the same way today. No amount of creative can fix a product problem.
- Seasonality. Some categories have natural demand cycles. If you’re selling sunscreen in November, the algorithm isn’t the problem.
- Competitive pressure. A new competitor entered with a better offer or more aggressive pricing. Your ads haven’t gotten worse. The market has shifted around you.
These are real constraints that no amount of ad optimization can solve. Recognizing them early saves significant budget and lets you redirect resources to where they’ll actually work.
How Gemoniq runs this diagnostic for D2C brands
This diagnostic framework isn’t something we run once. It’s embedded in the operating system we use to manage Meta Ads end to end for D2C brands.
Every week, for every account:
- Automated layer tagging. Our platform flags which layer is declining before anyone looks at the dashboard.
- Diagnosis, not guessing. We prescribe fixes based on which layer is broken, not based on what’s easiest to change.
- One variable at a time. Creative changes, CTA changes, and post-click changes are isolated so we know what actually moved the needle.
- Compounding learning. Every cycle’s findings feed the next cycle’s creative brief, targeting adjustments, and landing page recommendations.
The result: your ad account becomes a system that gets smarter every week, not a slot machine that occasionally pays out.
Get Your Free Ad Account Diagnostic
We'll map exactly which layer is broken in your Meta ad account and show you the specific fixes, whether it's creative, CTA, landing page, or post-click flow.
Architectural Intelligence
Get the weekly newsletter on design-led performance marketing, directly to your inbox.
No spam. Just intelligence. Unsubscribe anytime.